")
")

📊 Travel Accessibility Report – Helping Councils Improve Journeys 🚍

Details:
Many services fail not because of intent—but because they’re hard to reach. Our Travel Accessibility Report empowers local councils to design journeys that work for the people who need them most, particularly trauma survivors and vulnerable groups.
Using Excel-driven analysis and Power BI dashboards, we model travel times, accessibility barriers, and location viability across public transport and road networks. Whether you're selecting an interview venue or reshaping entire transport strategies, our reports transform raw data into clear, evidence-led decisions.
We also provide ongoing support to implement improvements—such as better signage, route adjustments, and schedule refinements—to reduce travel stress and promote safety across public-facing systems.
We have past experience in working with over 1200 separate locations, so we can accomodate your councils needs, no matter how big the operation may be.

🔍 What to Expect
- ✅ Tailored local data analysis: Route mapping, accessibility audits, and journey-time comparisons to key services.
- 📊 Stakeholder-ready dashboards: Travel patterns, demographic overlays, and lived-experience feedback.
- 🚀 Practical mobility strategies: Reduce travel strain and support access for underserved communities.
- 💰 Flexible pricing tiers: Scaled packages for councils of any size.

🧑🤝🧑 Who It’s For
- 🧑💼 Children’s Services Leads: Understand how transport affects children’s appointments.
- 🧭 Commissioners & Service Leads: Use data to assess public transport and catchment spread.
- 🏢 Estates & Planning Teams: Evaluate site accessibility and surrounding infrastructure.
- 🚌 Transport & Mobility Officers: Improve route equity for low-mobility users.
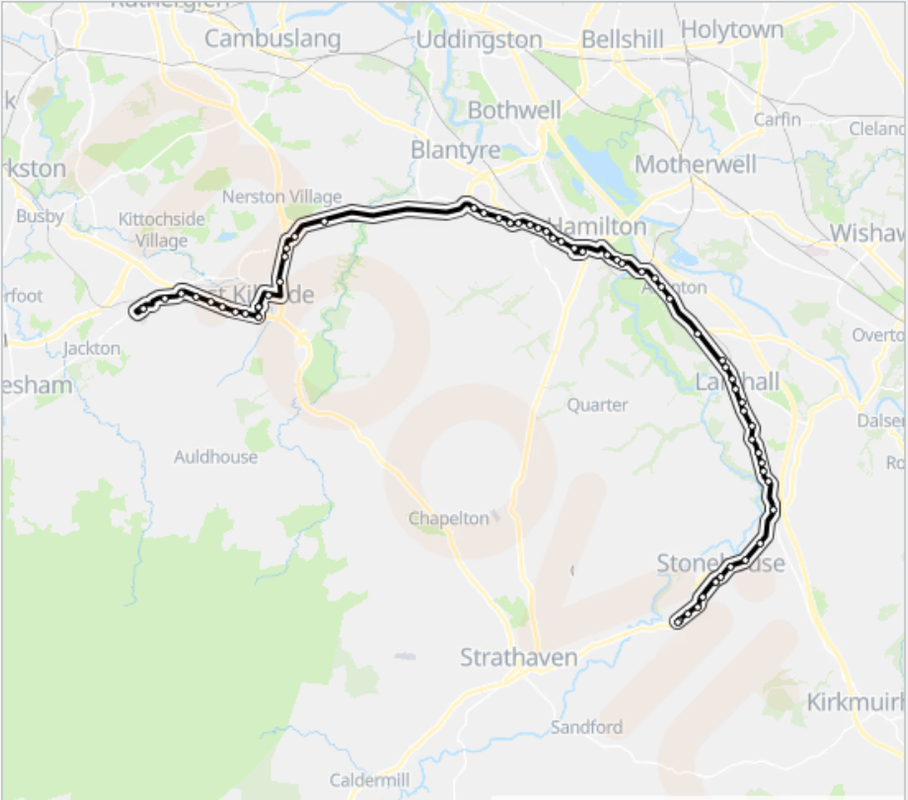
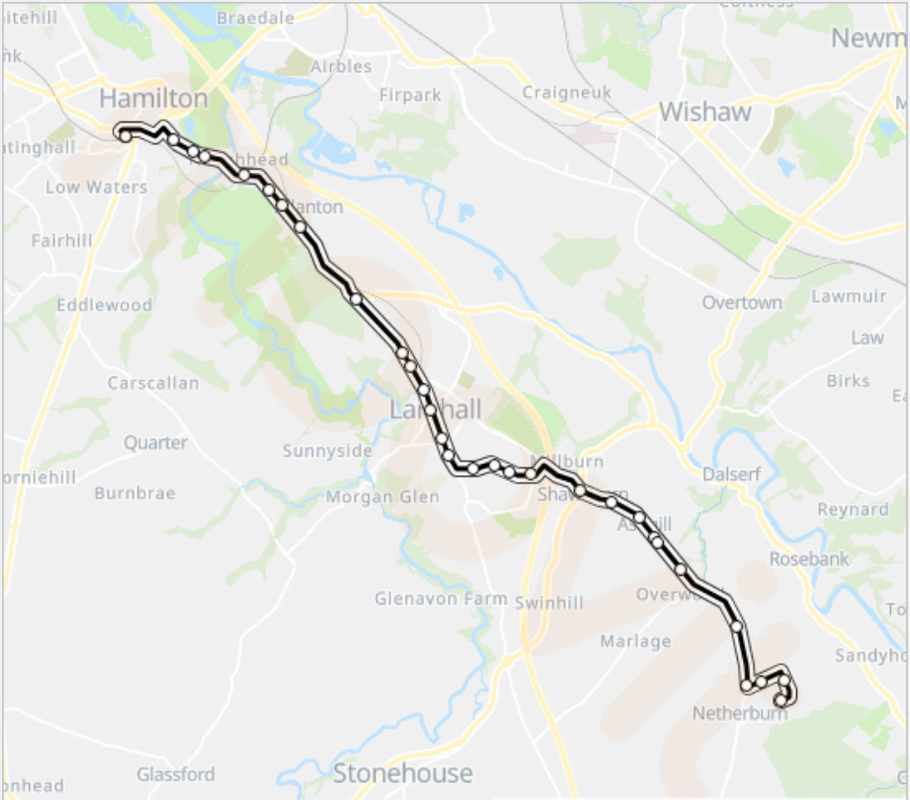
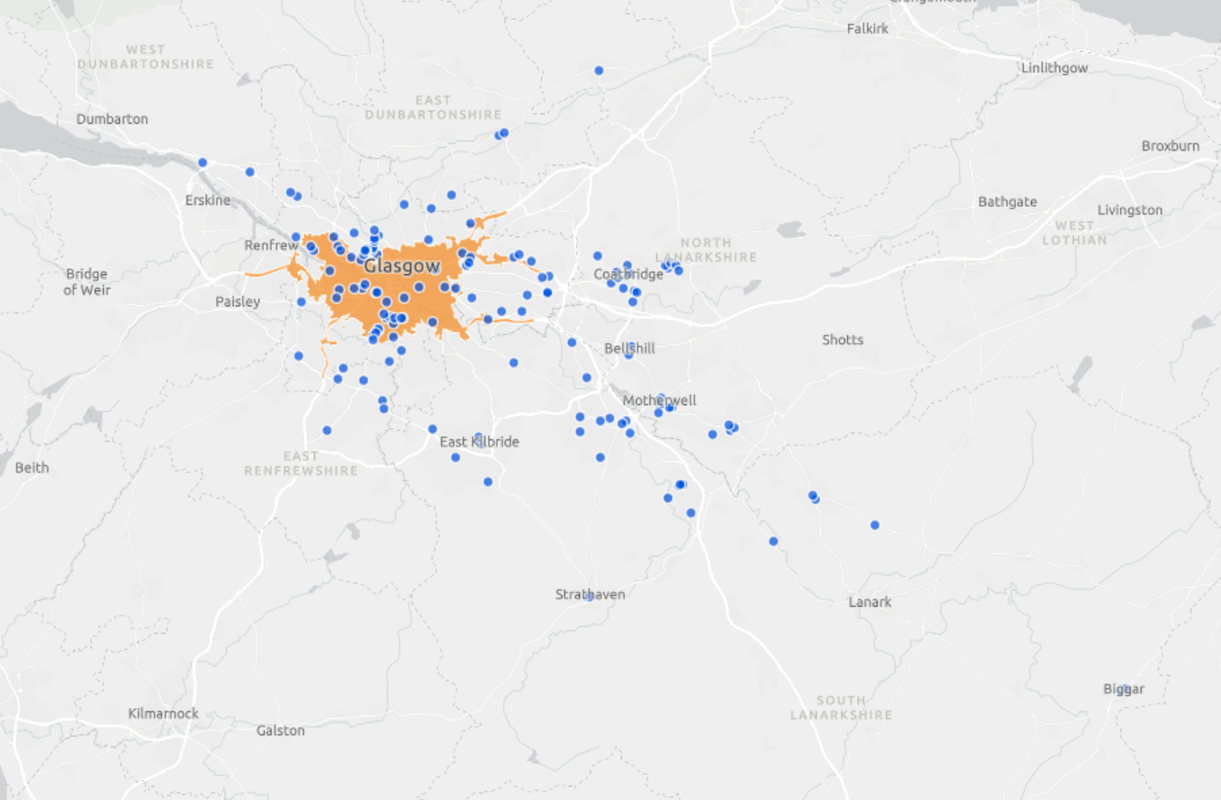
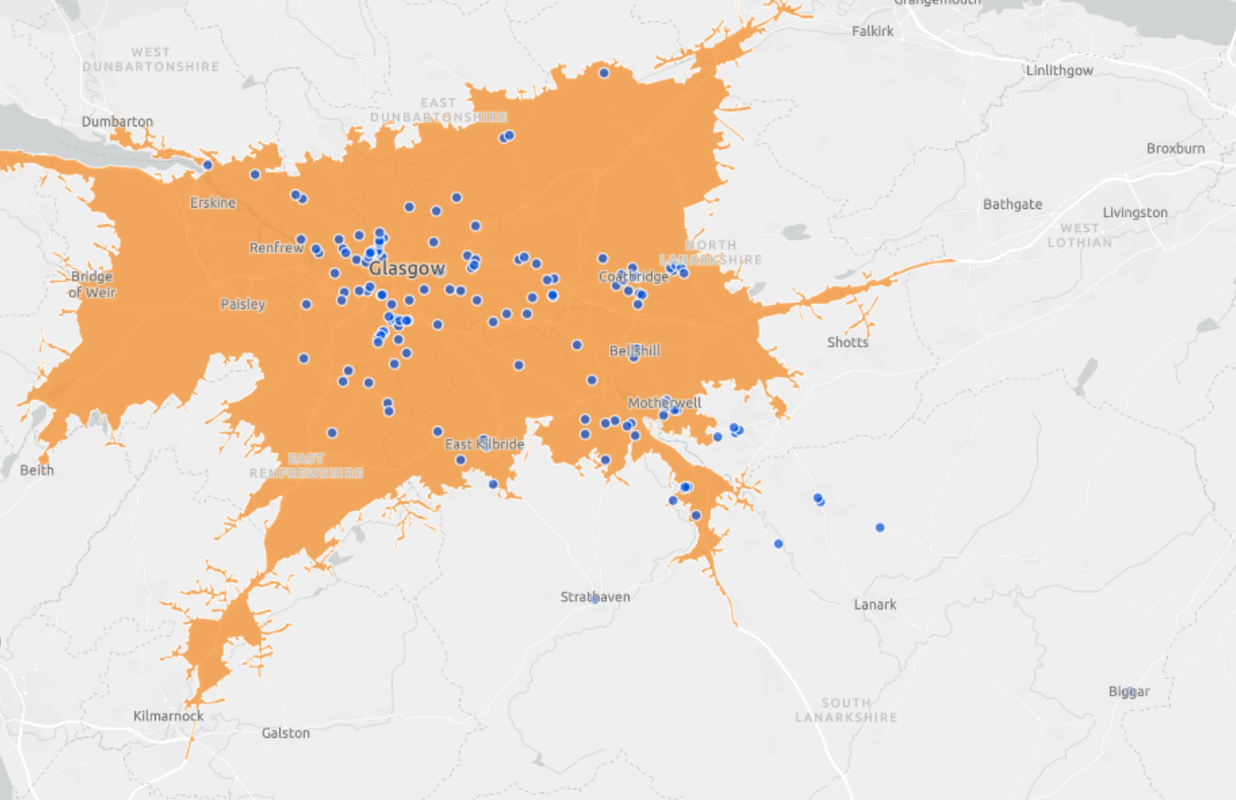
🗂️ Examples of Our Travel Report Content
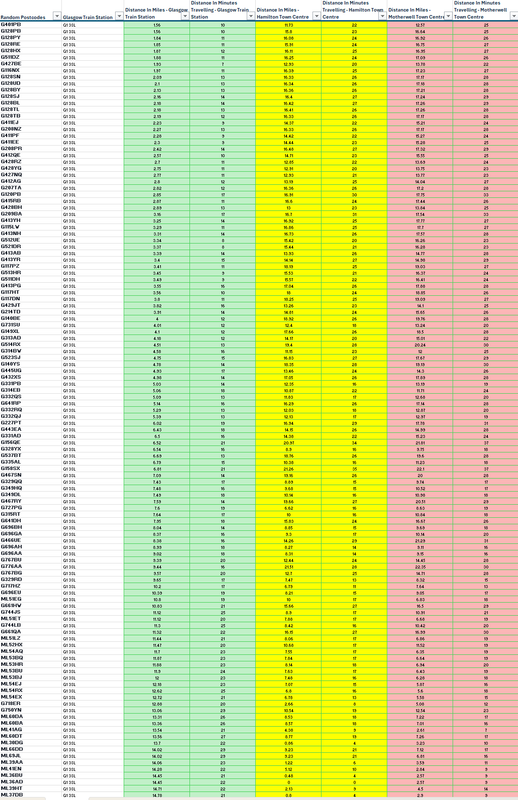
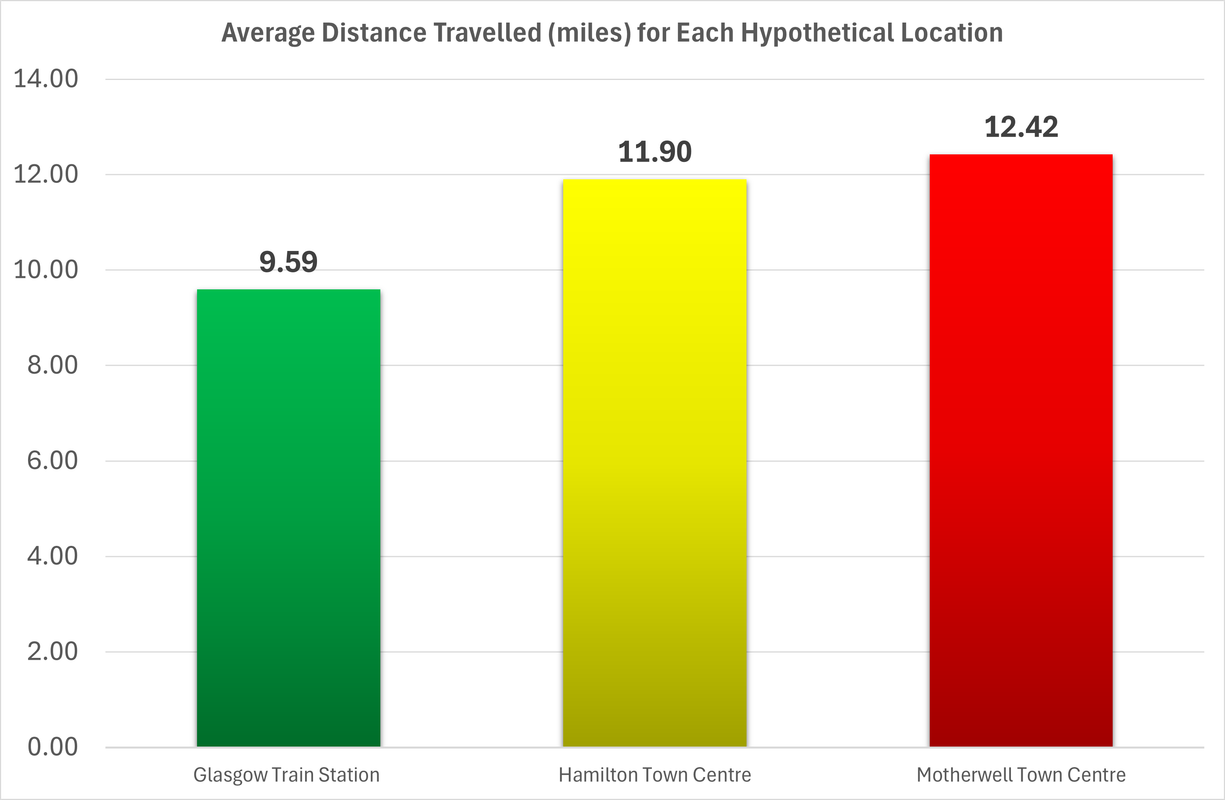
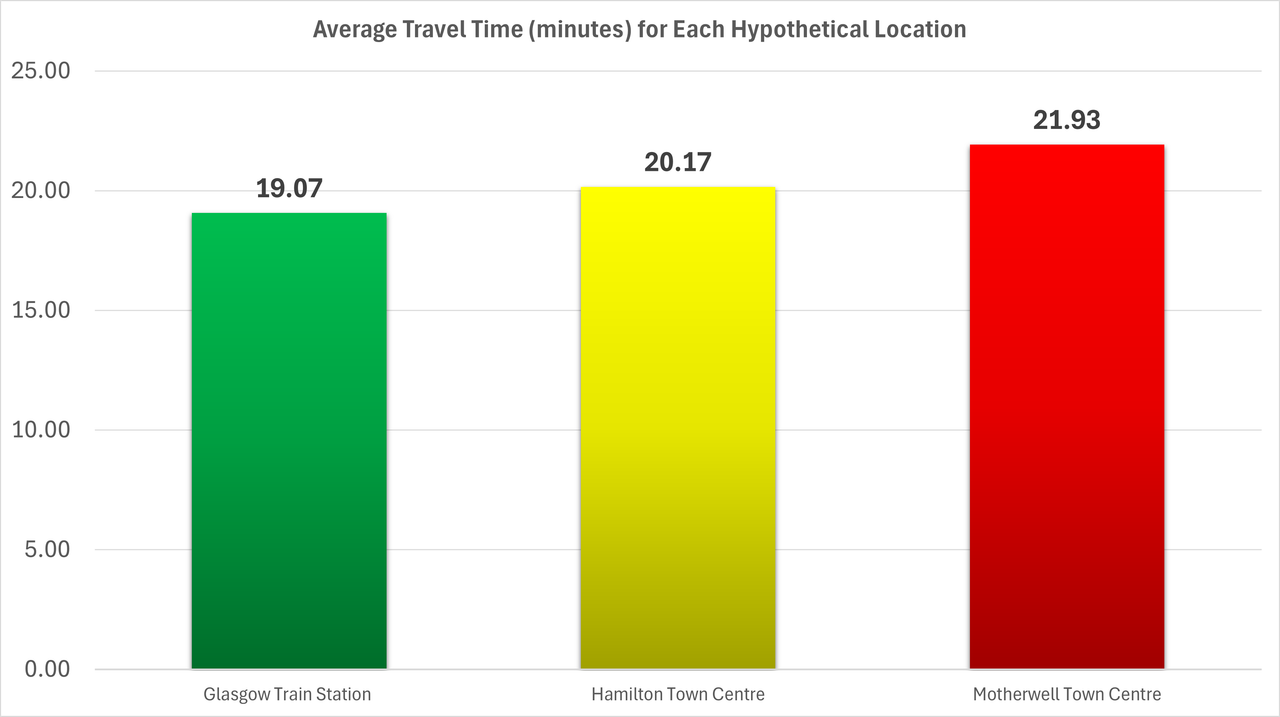
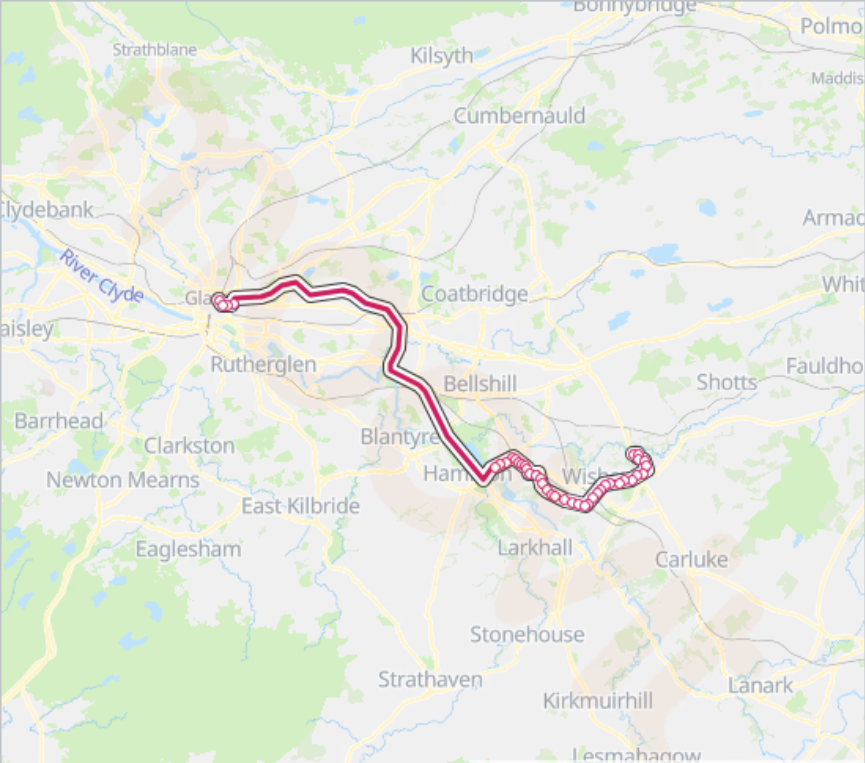
We analysed travel patterns using 150 randomly generated postcodes across Greater Lanarkshire and three key public locations. By calculating travel times and distances between these points, we developed a detailed, hypothetical report that highlights mobility barriers and opportunities for improvement. Below are selected visuals from our findings.
Learn more about how we supported Lanarkshire Councils in this project by visiting our case study page.
💡 Pricing Plans
Our pricing plans are highly adaptable to meet the unique requirements of your council. We’re committed to providing tailored solutions aligned to your needs. Reach out to our team to discuss the right level of insight for your project.

Basic Report
A quick-start package for councils wanting an overview of journey accessibility to a single site. Includes core metrics and visualisations to inform early-stage decisions, internal briefings, or stakeholder previews. Fast, affordable, and impactful.

Detailed Report
A deeper dive into multiple sites or postcode areas — perfect for strategic planning or formal reporting. You’ll get journey-time heatmaps, stakeholder-ready dashboards, and tailored insights to help shape inclusive access for your region.
Custom Report
Built for councils tackling complex geographies, multi-agency coordination, or community engagement. This fully tailored package includes layered datasets, interactive dashboards, and expert guidance to support funding bids, public consultations, and policy delivery.